

The most common question we get as Real Estate Analysts is - How's the market going? When people ask this question, invariably what they're asking is:
What are Melbourne House Prices doing?
In the short video below, we explain how to understand the most important graph that we track.
This Melbourne House Price graph shows four key metrics:
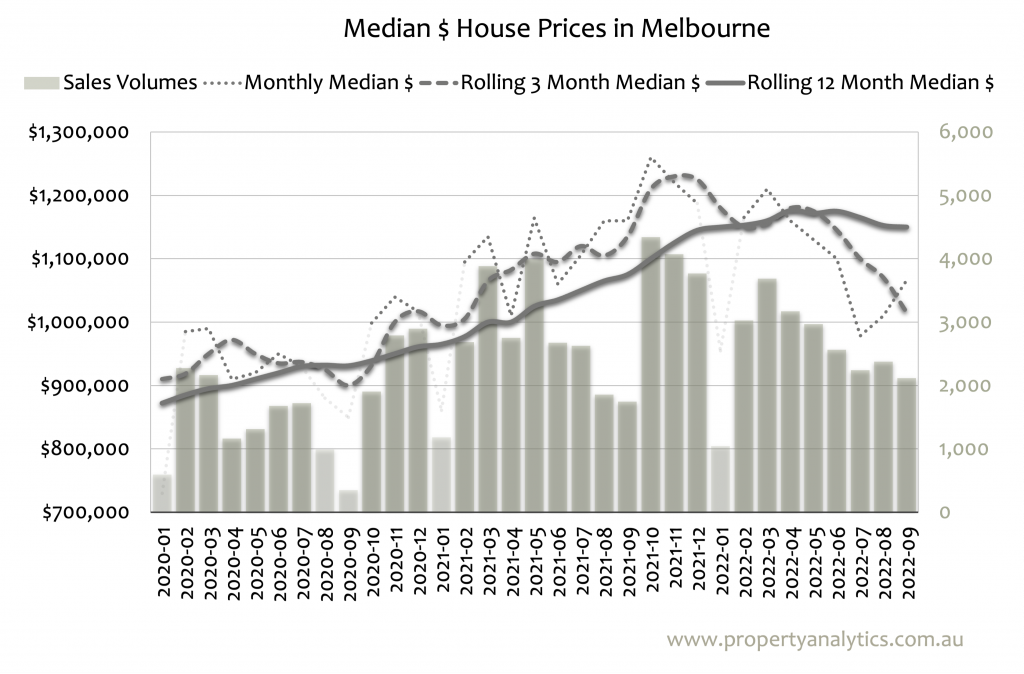
You want to be mindful of the number of sales considered, because when there are low sales volumes, the monthly price figures are less reliable.
Sales Volumes fluctuate seasonally. The number of houses sold typically peaks in late Spring, in October-November. Very few properties are listed for sale immediately following this period, so January typically sees very few sales, and the houses that sell in January are usually those that have languished on the market - sellers are more likely to accept a discount on their initial asking price. The market comes back to life in February and then ticks along until Spring approaches again.
Monthly Median $ House Prices naturally fluctuate quite a bit from month-to-month. Unfortunately, many in the media latch on to these dramatic changes as an easy way to get clicks.
It’s important not to over-interpret short-term changes in monthly results. String a few months together though, and you can get a good feel of emerging trends. Look at the significant change in the Monthly Median $ House Price from March to April 2020. While no credible Analyst pointed to it as a statistically significant change at the time, in retrospect, the drop was likely a COVID-induced market correction. When viewed retrospectively, they can be useful in identifying turning points in the market (e.g. previous peaks and lows).
We're always really interested in the current monthly median - whether it's up or down - but we interpret things with a grain of salt.
Rolling 3 Month Median $ House Prices smooth out the dramatic fluctuations seen month-to-month, and are useful for identifying emerging trends quickly.
Analysing Monthly and Rolling 3 Month Median $ House Prices together can be very informative. Look at the middle of 2019. The Monthly Median bottomed out in July, and then rose significantly in the months following. As we moved into September, it was clear to us that the market was rebounding and we encouraged our clientele to look seriously at some good buying opportunities.
The third way that we measure prices is by Rolling 12 Month periods. It is a slow-moving, conservative way to assess the market. While this method is not very useful for identifying emerging trends, it can provide some important historical context to people’s thinking.
This is figure that most responsible analysts reference when they talk about year-on-year % changes in median $ prices.
Are prices up, down, or sideways? And, of course, what does that mean for my property?
It's safe to say that prices jumped dramatically through 2020 and 2021, before decreasing through 2022. Keep an eye on the Monthly and Rolling 3 Month Median $ Price trends to identify potential emerging trends in the market.