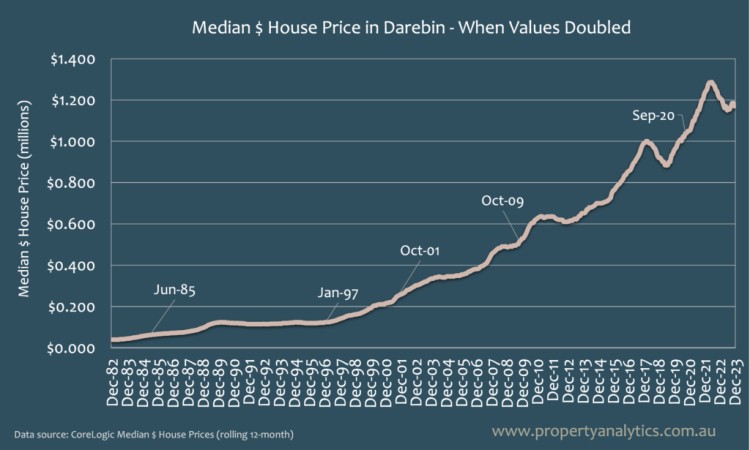
Darebin is a Council Area in Melbourne’s North that trends pretty closely to the city’s property market as a whole. The graph below illustrates how house prices have doubled in value over the past four decades.
It’s taken anywhere between 3 to 10 years for prices to double. Three further insights jump out from this graph:
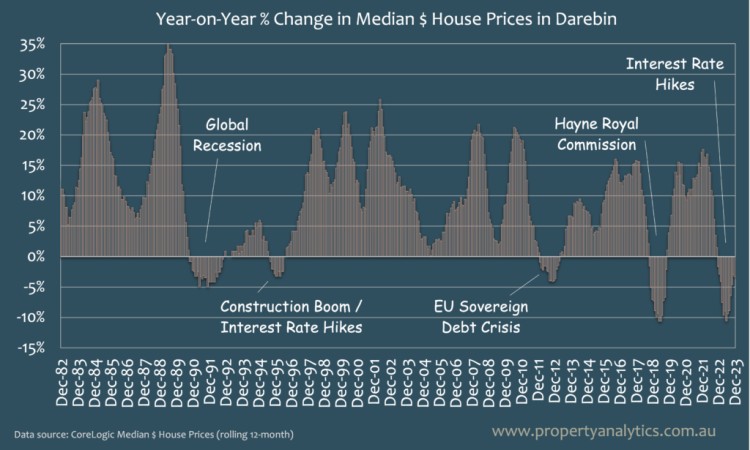
Another way to view price cycles is looking at Year-on-Year % Changes. At any given time, were house prices higher than the previous year or lower?
Considering the 3 points above, the mid 1990s were absolutely a great time to purchase given the 15+ years of uninterrupted capital appreciation.
The % growth from 2011 hasn’t been unusually high. The 1st graph suggests hockey stick growth from 2011 because the $ value levels are so much higher than previous decades (e.g. 15% growth from $600,000 is a lot more in dollar terms than 15% growth from $50,000)
Lastly, in 2018/19 we experienced the sharpest market correction in living memory.
Price growth returned for a few years but then 2022/2023 came along!! Price drops are pretty rare, so it’s natural to feel beaten up over the recent topsy-turvy market.
Many variables drive market downturns. We’ve highlighted what we think are the major causes in the 2nd graph above: global economic shocks, supply/demand imbalances, and government interventions.
Let’s cover each of these factors in a little more detail.
In the graph above, we’ve used Darebin as an example for price fluctuations in Melbourne since 1982. As you can see, major economic shocks such as the GFC in 2008 and the EU Sovereign Debt Crisis of 2010-11 have wide reaching impacts, even for somewhere as tucked away as Melbourne.
Jumping forward, it’s safe to say it’s been a turbulent few years across the world, and we’re certainly not immune to the ripple effects in Australia. From armed conflicts to inflation, oil price hikes, political turmoil and pandemics, there’s been a seemingly never-ending run of issues in recent times.
However, one of the things this graph can teach us is that even after a global economic crisis, the market has a remarkable ability to bounce back.
Much like house prices themselves, our city’s population has grown at a rapid pace. Let’s illustrate this by flashing back to 2000.
At this time, Melbourne had a population of 3,466,000 (Source: ABS), while Sydney was Australia’s largest city with a population of 4,085,578 (Source: ABS).
After years of being the largest city in Australia, Sydney was recently bypassed by Melbourne, taking the mantle with a population of roughly 5,316,000 people–that’s an almost 2 million jump over a 24 year period!
Both overseas migration and regional-to-urban movement have been key drivers of population growth. Although we’ve seen big high-density developments spring up in many suburbs (like those in Caulfield, Camberwell and Springvale, to name a few), supply has still struggled to compete with demand.
Whether you’re a homeowner or simply following the news, you’ll be well aware of the ongoing challenges that have come with rising interest rates. While interest rates have been in a relative state of flux in the past few decades, many people have really felt the crunch in recent years.
Since March 2022, the RBA has consistently raised the national interest rate to the point that the four major banks are now predicting a peak of 4.60% this August.
As we’ve noted on the graph, these higher interest rates appear to have a direct correlation to house prices in Melbourne. In simple terms, the prospect of higher repayments is a natural deterrent for many potential buyers. This, in turn, means lower buyer confidence, and less buyer confidence = less competition.
It’s no surprise that Toorak and Brighton were Melbourne’s most expensive suburbs to buy into back in 1990. However, when you look at the median price compared to today, the figures might shock you.
In 1990, you could buy a Toorak property for around $680,109, one in Brighton for $334, 982, as well as a Kooyong home for approximately $291,439. It’s also worth noting that these prices were for homes, not units or apartments–fair to say this is quite a different picture from today!
To illustrate this, we only need to look at one of the suburbs located in the City of Darebin. In Fairfield (3078), the median house price for the last calendar year is $1,545,000 (more than double that of Toorak just over 30 years ago).
When you’re talking about a city that’s repeatedly earned the title of the world’s “most liveable”, it’s only natural that buyers will be clamouring for homes, apartments, and other properties across the inner city. This, in turn, has led to significant price increases over the past 30-40 years.
Since the 80s and 90s, traditional working class suburbs like Collingwood, Fitzroy, Richmond, Northcote and more have all experienced a major increase in both buyer interest and competition–including buyers from overseas.
If we look slightly beyond house prices to the average cost of rent, inner city suburbs are also some of the most expensive places for tenants.
As noted by the Australian Department of Infrastructure, suburbs in the middle ring “typically exhibit lower density than inner city areas but often have high-density precincts around public transport hubs.” (Source: Infrastructure Australia). In plain terms, this means that they share characteristics with both inner city and outer suburban areas, such as access to employment, public transport, and amenities.
Oakleigh, Essendon and Doncaster would be a few prime examples of Melbourne’s middle-ring suburbs.
Looking at the house price data for outer suburbs is also another indication of how much things have really changed. Let’s use data from 1999 to illustrate this:
Back in 1999, the average house price for Pakenham was 117,250, and 118,000 for both Werribee and Frankston (Source: Planning Victoria). In 2024, the median prices are now $650,000 for Pakenham, $612,000 in Werribee, and $740,000 in Frankston.
As you can see, major house price increases aren’t only occurring in the inner and middle rings. Despite this, there is still value to be found across the city–especially when you partner with a knowledgeable, experienced, and data-driven buyer’s agent.
Although we’ve covered various trends for existing properties, this is only one piece of the puzzle. This naturally leads us to another key question, “what about the price for a block of land?”
This is where it pays to partner with us and work with a real estate development expert in Melbourne. With years of Australian property investment experience, the Property Analytics team can provide end-to-end assistance for development opportunities across the city.
Whether we’re providing a feasibility study report on a Melbourne development, or helping you to obtain council planning permits from a Melbourne council, we prioritise your best interests and utilise cutting-edge market metrics to help you secure a block of land with real long-term potential.
For Darebin house prices to double from September 2000, they need to rise by $1m. That sounds fanciful, but I’m reminded of my wife telling her dad “You’re crazy for not buying two houses in 1997 for $100k each!”.
House price growth will return. I encourage you to consider your finances and get ready to take advantage of the next upswing. We’re always available for a chat, so don’t hesitate to get in touch with our dedicated buyer’s agents!
Property Analytics are licensed Buyers Advocates and independent Real Estate Analysts based in Melbourne.
Property buyer clients appreciate our data-driven approach to securing their high-growth property investments. We specialise in assisting small property developers to acquire profitable sites and complete projects from start-to-finish.
Real Estate and Financial Services professionals rely on our market research to understand important market trends. Our Director presents to dozens of groups annually.
Read dozens of Client Case Studies to understand how we’ve helped buyers over the last 15 years.